Part 6: Dashboard
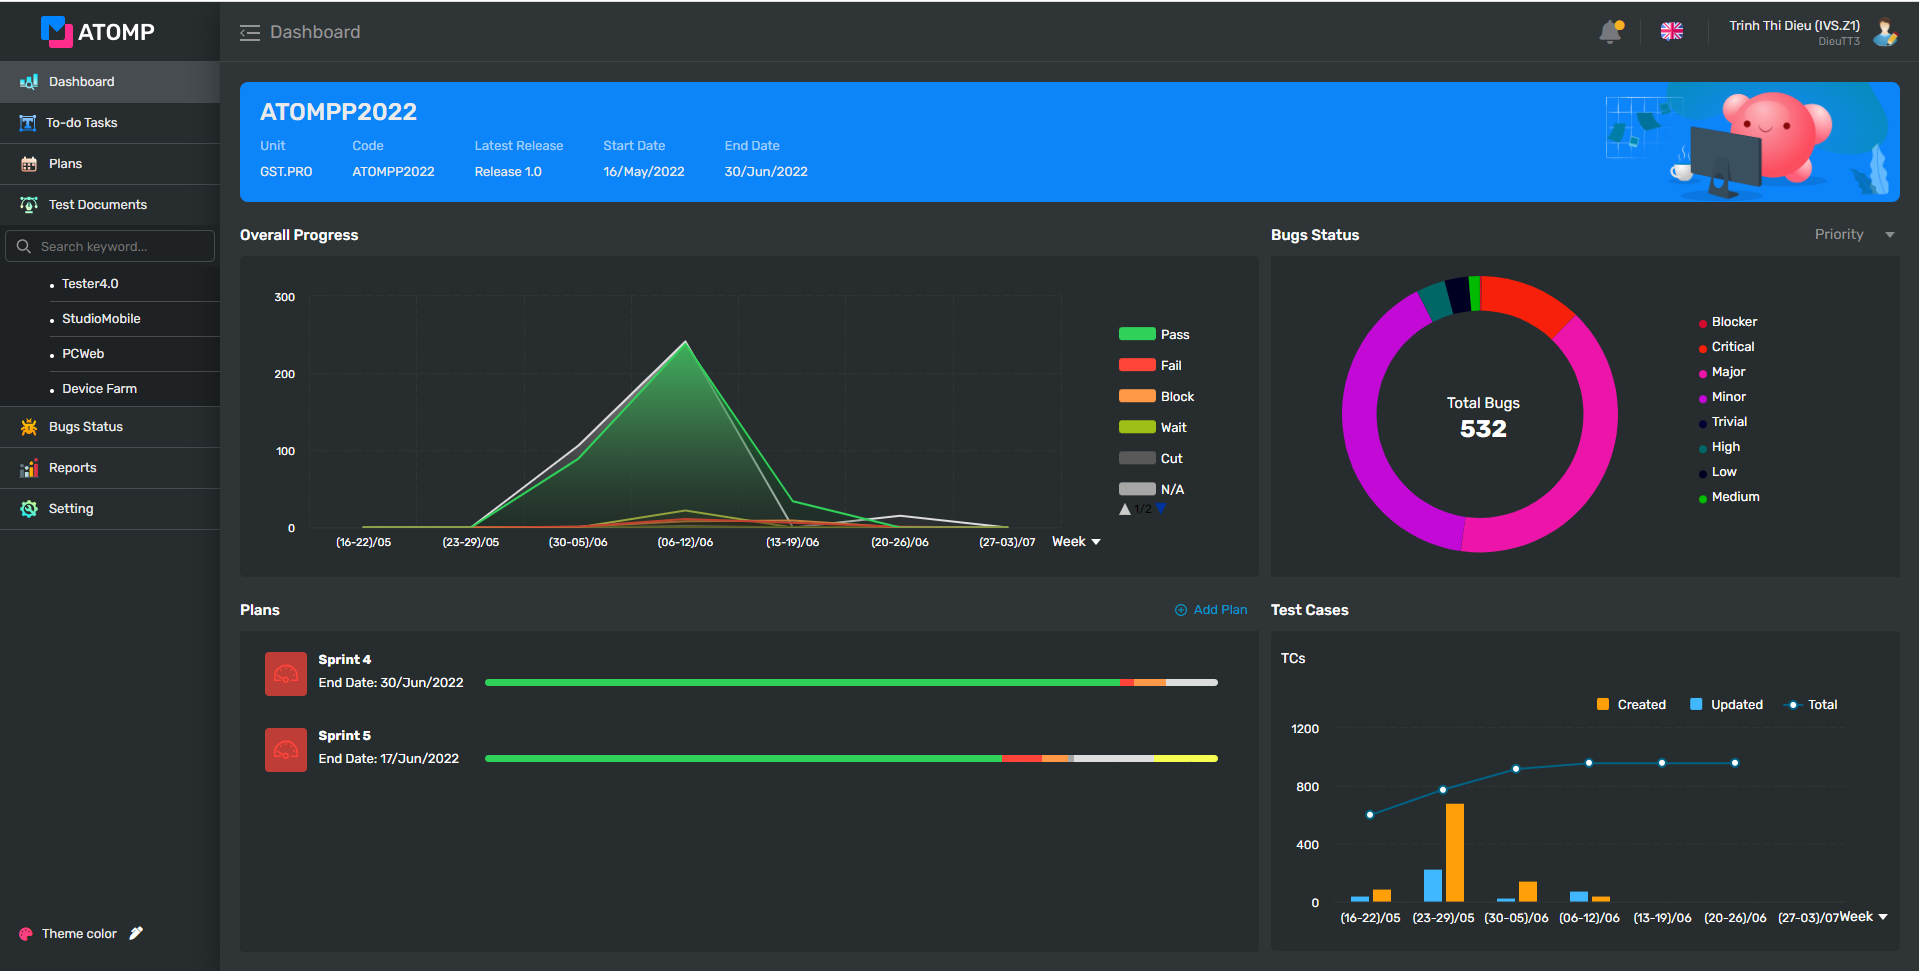
Dashboard is an overview screen of the progress of test documentation creation, test execution, number of bugs … in the project.
- Open Dashboard screen: User clicks on icon Dashboard from the left menu.
- View Overall Progress: User can see the test result corresponding to each status of the day/ week/ month.
- View Bug Status: User can see the total number of bug status on the pie chart by moving the mouse pointer to area of each fault state on pie chart to see detail.
- View Progress of Plan: User can see if a Plan has the status as Not Done.
- View chart Created – Updated test case: User can see the number of test cases created and updated each day /week/ month of Project.